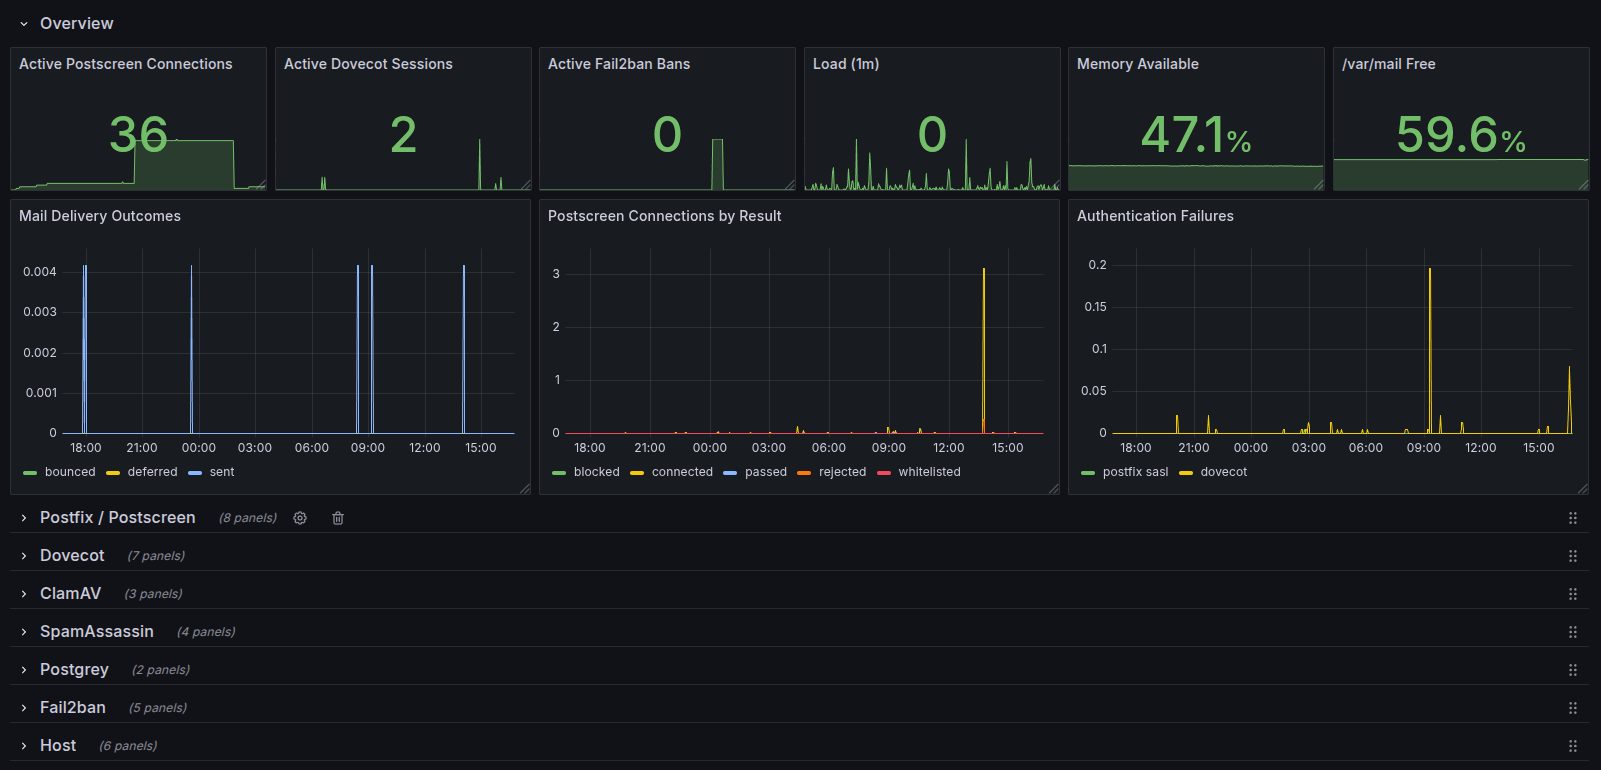
ulaknode ships with an optional Prometheus exporter sidecar that turns the mail stack's logs and resource usage into metrics, plus a ready-made Grafana dashboard to visualize them.
No third-party dependencies on the exporter side — it's a single Python process built on the standard library, running read-only against the same log and data volumes as the main container.
What's monitored
- Postfix — Postscreen connections/DNSBL hits, SASL authentication failures, delivery status
- Dovecot — logins, login failures, active sessions, LMTP local deliveries
- ClamAV / freshclam — update and database status
- SpamAssassin — scans, spam hits
- Postgrey — greylisting rejections
- Fail2ban — bans, unbans, SMTP rejections caused by bans
- Host — load average, memory, disk usage, network throughput
Grafana dashboard
The dashboard has an always-visible overview row with the at-a-glance health signals — active connections/sessions/bans, load, memory, mail storage free space, delivery outcomes, and auth failures — with everything else grouped by component in rows collapsed by default.
Getting started
The exporter runs as a sidecar container next to the main ulaknode container, reading its log and data volumes read-only and serving metrics on port 9101.
docker run -d \
  --name ulaknode-exporter \
  -p 9101:9101 \
  -v ulak_logs:/var/log:ro \
  -v ulak_mail:/var/mail:ro \
  -v ulak_clamav:/var/lib/clamav:ro \
  itefixnet/ulaknode-exporter:latest

curl http://localhost:9101/metrics
The image, full configuration reference, and a Compose example are available on Docker Hub.